Motivation
Since I live in an apartment, growing crops under ideal conditions is not straightforward. The three most important environmental factors are temperature, humidity, and sunlight.
The only available growing area is my small balcony, which is approximately 2.4 m × 1.1 m and is east/south-east-facing, based on compass measurements. I already have four railing planters, so these will be used first.
The goal of this project is to collect environmental data before planting, choose crops that are well suited to the measured conditions, and optimize their growing period by providing the right amount of nutrients and care for those conditions. Measurements will then be taken throughout the process to evaluate plant growth and environmental changes.
System overview
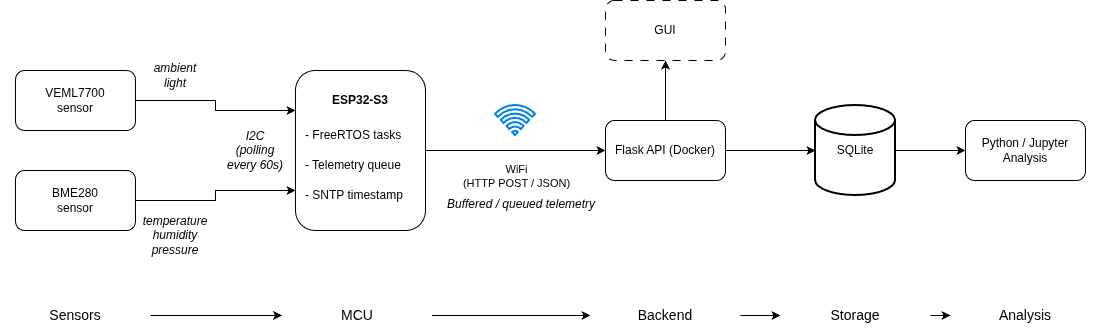
The 2 main sensors used are the VEML7700 and the BME280. The VEML7700 measures the ambient light and the BME280 the temperature, humidity and pressure.
These sensor are connected to the ESP32 via the I2C bus and the measurements are polled every 60 seconds. The measurements are placed in a queue waiting for all the reads to be complete. After both readings are available, a JSON object is created, an SNTP-based timestamp is added, and the data is sent to the backend using an HTTP POST request.
The backend implements a Flask API with an SQLite database and a GUI, running on my server in a docker container.
The data is then processed, analyzed, and examined for correlations.
(All of the components were ordered from Aliexpress, see References for the links.)
Embedded hardware and data collection
Development board
The prototype was developed and tested using a development board based on the ESP32-S3-WROOM-1-N16R8 module. This module was chosen mainly because it was the only available option at the time.
Understanding the separation of the names and terminologies:
| Term | Meaning |
|---|---|
| ESP32-S3 | The actual MCU / SoC chip. |
| ESP32-S3-WROOM-1 | A module built around the ESP32-S3 chip, including RF circuitry, antenna, flash memory, and other supporting components. |
| N16R8 | The specific module variant, indicating 16 MB flash memory and 8 MB PSRAM. |
| Development board | The physical prototyping board that contains the ESP32-S3-WROOM-1-N16R8 module, along with additional hardware such as USB-C connectors, voltage regulation, buttons, pin headers, and programming/debugging circuitry. |
Espressif describes the ESP32-S3-WROOM-1 as a 2.4 GHz Wi-Fi and Bluetooth LE MCU module based on the ESP32-S3 series SoC. The N16R8 ordering code corresponds to 16 MB Quad SPI flash and 8 MB Octal SPI PSRAM. These memory capacities are more than enough for this prototype.
The development board also features 2x USB-C connectors.
Sensors
The sensors were chosen based on initial research, price and availability. The general idea was to pick something for the prototyping that just works.
Power & placement
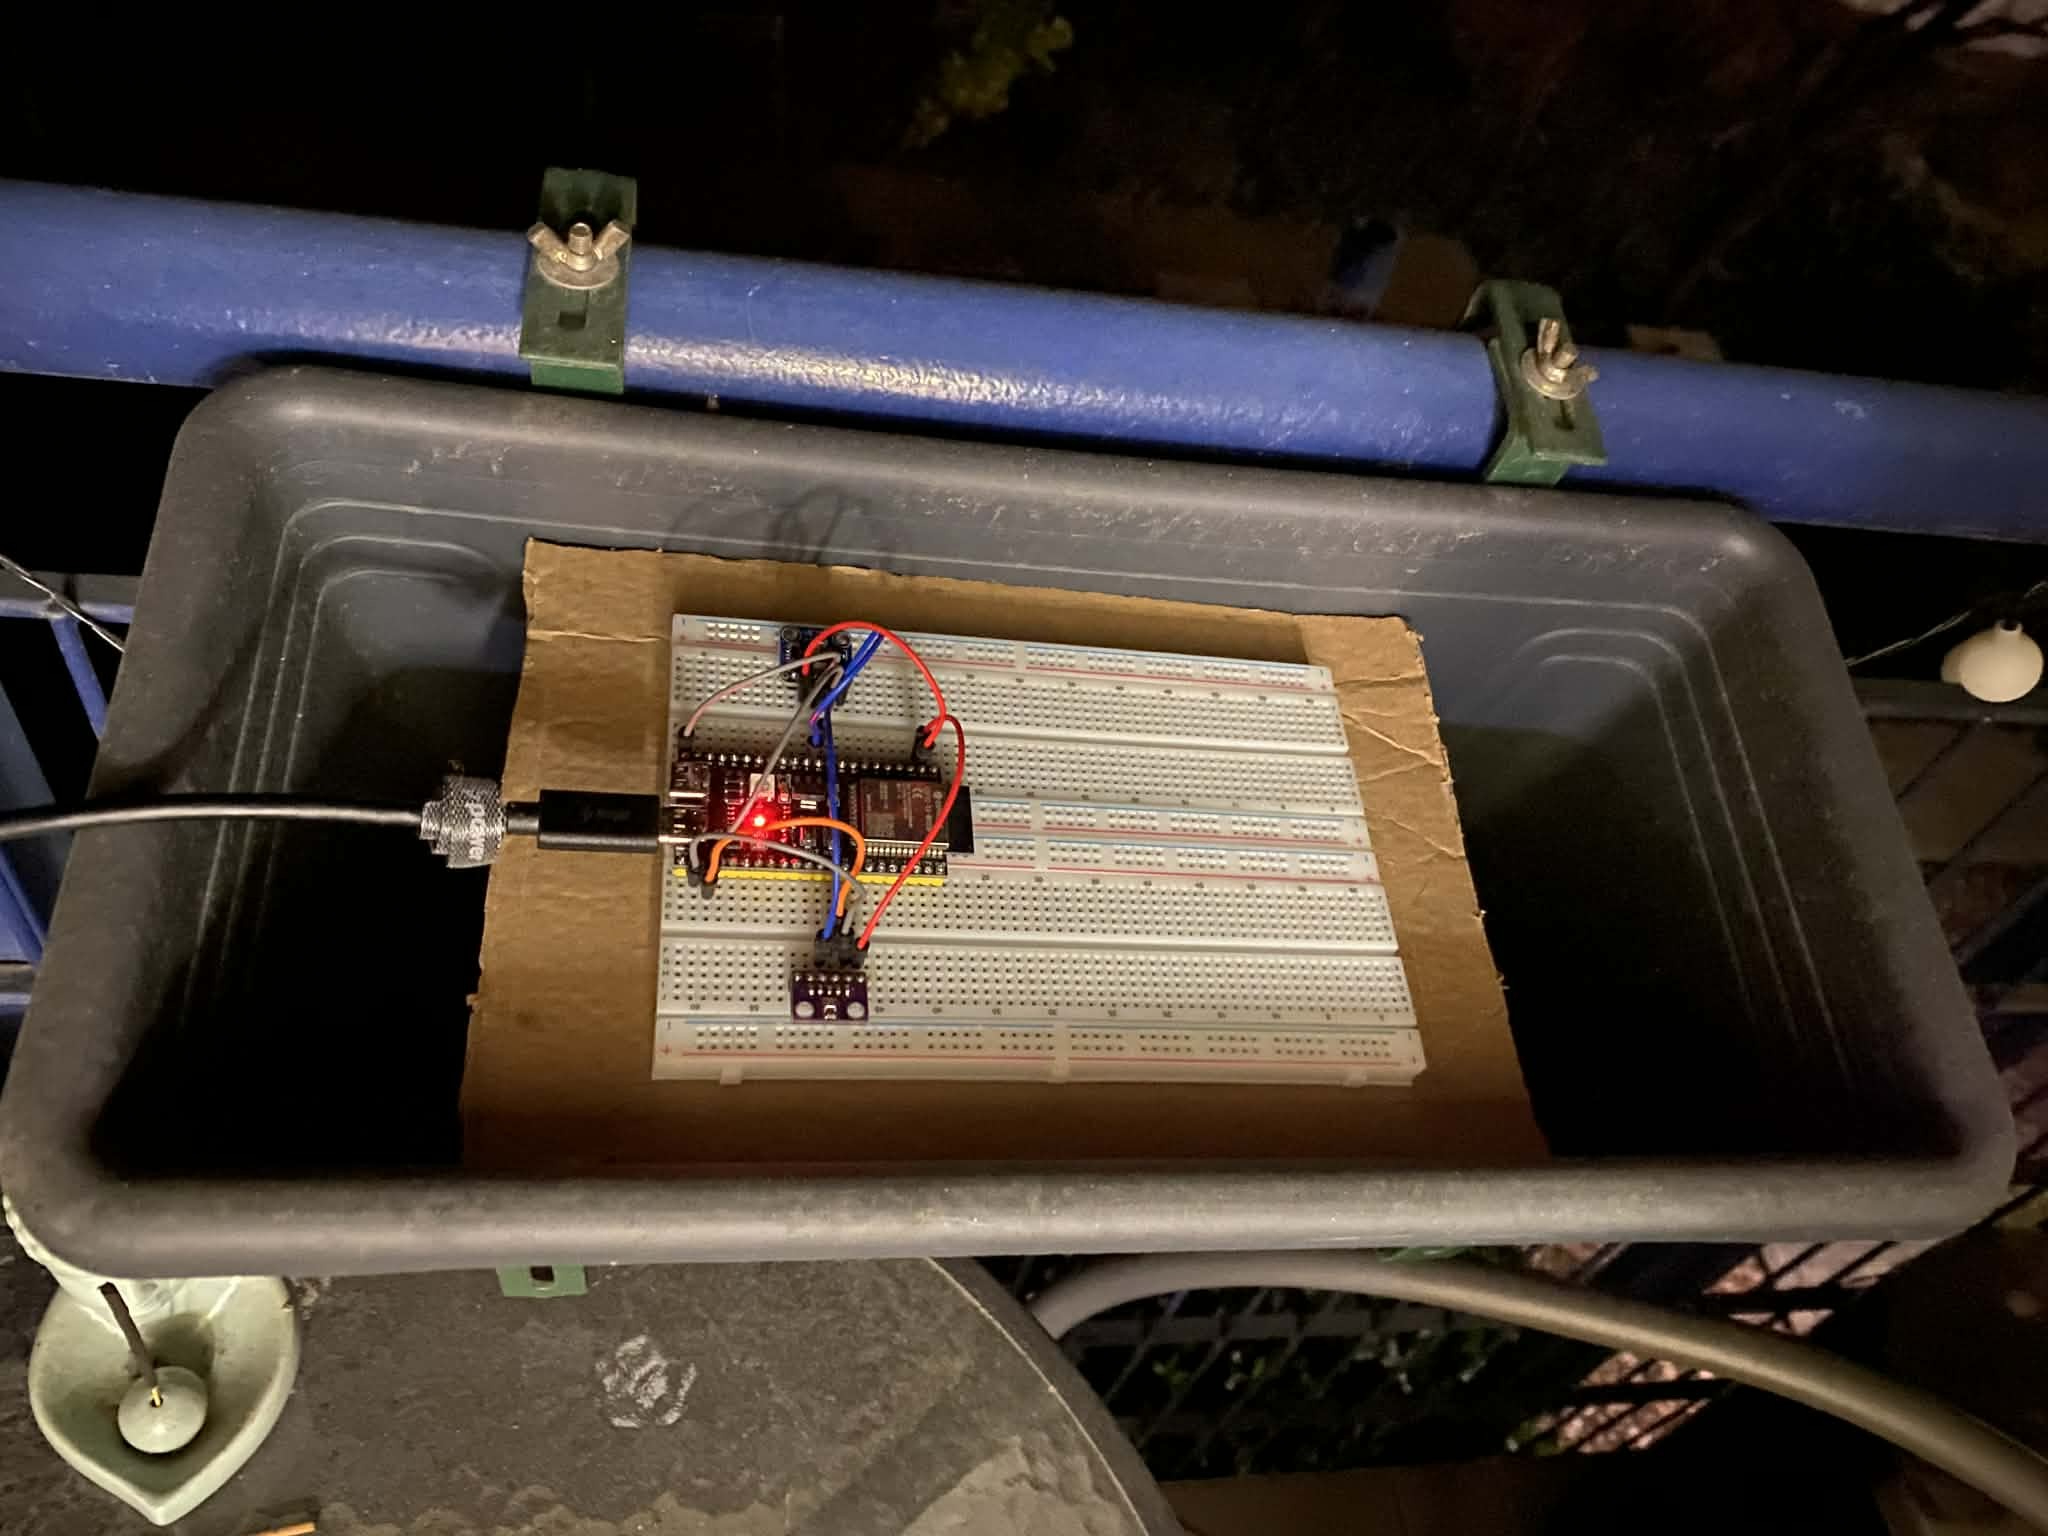
The board is powered through USB-C using an outlet available on the balcony.
To simulate the place of the plants, the development board was placed inside a railing planter supported by cardboard pieces.
Data collection and timing
Since I already had experience with HTTP requests and I chosen Flask for the backend (see in later chapter) this made perfect sense.
However, this decision also introduced some limitations that may not have occurred with a protocol such as MQTT.
The main challenge was the timing of the data transmission. The sensors do not all produce measurements at exactly the same time, meaning that the data from each sensor may become available at different moments. Sending each measurement individually would make the backend receive incomplete or unsynchronized data.
To solve this, a queue-based approach was used. The measured values are collected and temporarily stored until all required sensor readings are available. Once the necessary measurements have been received, they are combined into a single JSON object and sent to the backend using an HTTP request.
Backend
The backend of the system was implemented using Flask, a lightweight Python web framework. Flask was chosen because I had already worked with it before when implementing a backend for controlling a Rohde & Schwarz power supply unit. Because of this previous experience, Flask was a practical choice, as it allowed me to set it up quickly and with relatively little overhead.
The embedded device is responsible for collecting and sending the data, while the backend is responsible for receiving, storing, and serving the measurement data.
Data storage with SQLite
The measurement data is stored in an SQLite database. SQLite was chosen because it is simple to use and does not require installing or configuring a full database server. The entire database is stored in a single file, which makes it easy to manage and copy.
Since the amount of data in this project is limited, the performance and features provided by SQLite are sufficient. Using a more complex database system, such as PostgreSQL or MySQL, would have added unnecessary setup and maintenance work.
SQLite also integrates well with Python, making it easy to create tables, insert new measurements, and query stored data from the Flask backend.
GUI
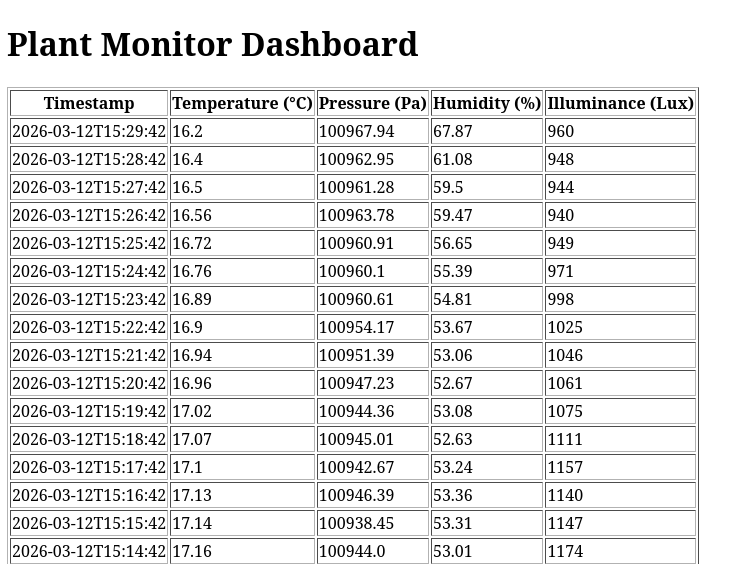
The graphical user interface is implemented as a simple HTML page served by the Flask application. The page displays the stored measurement data in a basic format.
The interface is intentionally kept simple and is not dynamically updated.
Why this stack was chosen
The combination of Flask, SQLite, and a simple HTML interface was chosen because it provides a good balance between functionality and simplicity.
Data analysis
For the data analysis Python + Jupyter is used. I have never really used notebooks and this seemed like a task which is perfect for it. Also this was the first time learning and digging deep into matplotlib.
GNU Octave was also considered and I did try to work with it for a couple of days, but in consideration of time and experience I went with python.
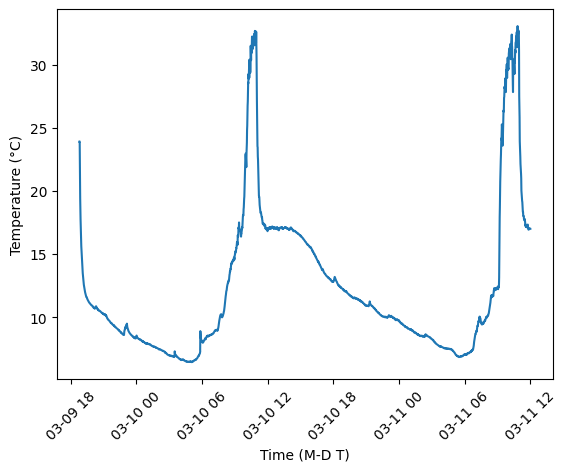
The first analysis step focused on visualizing the collected temperature and light measurements over time. This helped verify that the data pipeline was working correctly and provided an initial overview of the balcony conditions:
Future improvements
The current version works as a prototype, but several improvements could make the system more reliable, compact, and suitable for long-term use:
-
Switch to MQTT: Replace HTTP communication with MQTT, which is better suited for lightweight sensor-based systems.
-
Design the terrace layout: Plan the placement of the planter boxes, sensors, cables, power supply, and possible watering zones.
-
Research a smaller MCU: Look for a more compact and optimized MCU or module that better fits the final version of the project.
-
Design the enclosure in FreeCAD: Create a protective case for the electronics, considering outdoor use, cable routing, and mounting.
-
Design a custom PCB: Replace the prototype wiring with a cleaner and more reliable PCB-based solution.
-
Add camera-based image analysis: Use a camera module to monitor plant growth and detect visible signs of plant health problems.
-
Add an automatic watering system: Use sensor data, especially soil moisture, to control watering automatically.